Instructional Design
Learning Analytics
Client
Dartmouth Health
About
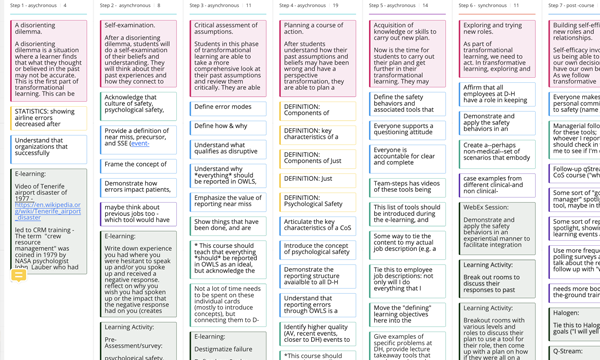
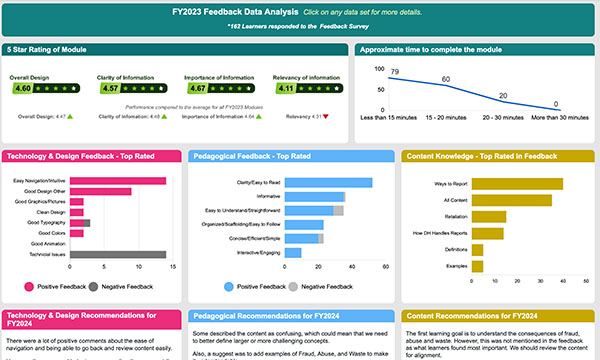
As part of an innovative eLearning Hub created in Smartsheet, I analyzed qualitative feedback data by aligning it to the TPACK framework and visually presenting learning analytics to SMEs and other key stakeholders.
Development Process
After approximately 11,000 learners completed their annual eLearning modules, I gathered feedback data through a survey conducted on Qualtrics. This survey received 3,000 responses and covered 14 different learning modules. I imported the data into Excel to gain deeper insights into each module's performance and began coding the qualitative feedback using the TPACK framework (Technology, Pedagogy, Content Knowledge).
Initially, I analyzed one-third of the data and then developed formulas to code the remaining feedback. This process involved examining my existing codes, creating and refining formulas, and validating the process against the previously coded data.
Subsequently, I transferred the analyzed data to Smartsheet and created a Dashboard for each module to present the learning analytics visually to subject matter experts (SMEs) and key stakeholders. The Dashboard allows them to review past modules, access compliance transcripts, and request updates.
Non-annual eLearning modules are setup to dynamically pull in survey responses and update the Dashboards on a daily process. The Smartsheet eLearning Hub also serves as a platform for presenting learning guidelines and micro-learning modules developed in Adobe XD.
Software
Microsoft Excel, Smartsheet, Adobe Illustrator and XDOther Instructional Design Projects
The Accident at Tenerife
An animated instructional video about the airline accident at Tenerife Airport that killed 583 people.


Biosafety Level 2 Learning Module
An interactive lecture developed in Articulate Storyline focusing on safety procedures for Level 2 labs.
Curriculum Development of a Patient Safety Course
An example of the curriculum development process for a system wide patient safety course.
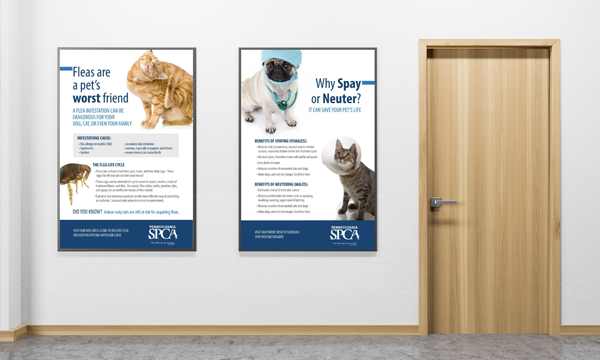
Animal Welfare Posters
A series of educational posters designed to hang within the Pennsylvania SPCA’s waiting room and hallways.

The ALERT Method
An animated video of an overview of a debriefing method for Drexel’s Emergency Medicine department.

Gone Vegan
An educational board game that promotes an understanding of the environmental and nutritional aspects of the vegan diet.
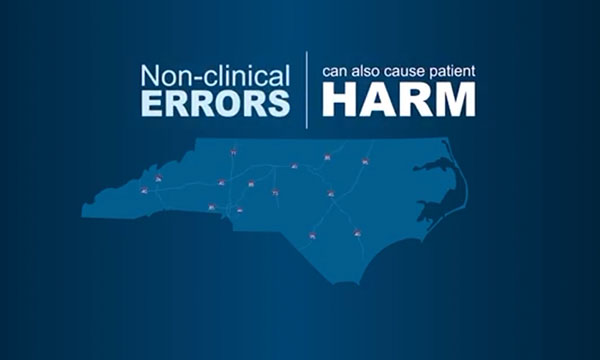
Non-clinical Errors Can Also Cause Patient Harm
An animated explainer video focusing on a medical error that took place at Duke University Health System.
Smartsheet Learning Analytic Dashboards
An innovative eLearning Hub created in Smartsheet to analyze qualitative feedback data by aligning it to the TPACK framework.

Remote Guide for Employees
A PDF guide on working remotely that was distributed to newly remote employees.

Manager Onboarding Course
Developed within Articulate Rise and Storyline, this course focuses new manager training.

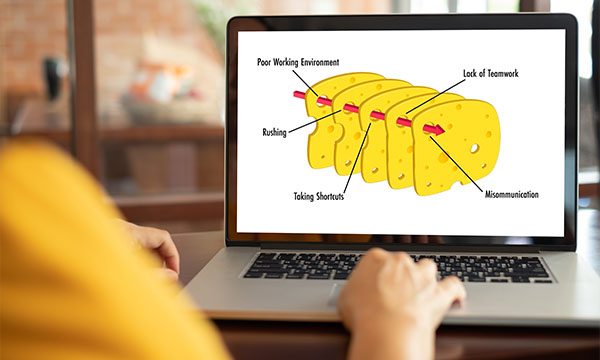
Healthcare Simulation Videos
A video developed to show a medical error that occurred during a simulation so students can practice debriefing.